Yuhao Huang
Changchun Institute of Applied Chemistry, Chinese Academy of Sciences, and School of Applied Chemistry and Engineering, University of Science and Technology of China, 96 Jinzhai Road, Hefei 230026, China
More by Yuhao Huang, Jiayu Li, and Hongyu Wang*
Cite this: ACS Appl. Energy Mater. 2019, 2, 6, 4544–4550
Publication Date:May 30, 2019
Abstract
It was taken for granted that the charge and discharge processes correspond with distinctly opposite directions of ionic flow when the energy storage mechanism of dual-ion battery was concerned. This common sense is challenged as we find a remarkable countercurrent in the cyclic voltammetric curve during the deintercalation of tetrafluoroborate anions from graphite electrode using ethylene carbonate solution. By electrochemical analysis, there is believed to be backflow of anions during the deintercalation process. The cause of this abnormal ionic flow relates to both the desolvation and resolvation of the intercalated anions inside the graphite electrode. Supportive evidence is provided.
inside the graphite electrode. Supportive evidence is provided.
Introduction
The commercialization of lithium-ion batteries (LIBs) since 1990 actually announced a successful concept innovation in the technology of electric energy storage. This achievement could be basically ascribed to the sagacious employment of intercalation electrode materials instead of traditional redox couples in electrochemistry. Monoatomic cations like Li+ generally act as the charge carrier under such circumstance. In contrast, polyatomic anions have seldom involved into this task before. It was only from the recent decade that anion–graphite intercalation compounds began to draw extensive attention as a high-potential positive electrode material in hybrid supercapacitors and dual-ion batteries. (1−26) At present, one of the uncertain factors that can profoundly influence the performance of graphite electrode lies in the solvation of anion, which may incur both the irreversible electrolyte decomposition at the surface (27) and the irreparable structural damage inside the bulk of graphite electrodes. (14) Although these risks can be masterly avoided by using ionic liquid, (22,23,28−32) their high costs cannot be accepted in industry right now. Therefore, fundamental investigations on the storage behavior of anions in the presence of organic solvents are of great importance.
Among the organic solvents commonly used in LIBs, ethylene carbonate (EC) appears the most compatible with Li+ intercalation into graphite anode. (33,34) On the contrary, it retards some anions intercalation into graphite cathode. (35−40) This phenomenon mainly originates from the solvation of anions by EC, and the suppressive effect considerably depends on the anion type. As a popular electrolyte anion, BF4– intercalates into graphite electrode from neat EC with a very unique manner. (38) During the charge process, both an uptake of the anion into and a release of EC from the graphite electrode take place at the same time. This implies that some co-intercalated EC molecules separate from their coordinated anions and escape into the solution, which may further complicate the intercalation mechanisms. It was taken for granted that the deintercalation of ions from an electrode is principally the inverse process of their intercalation within a chemically reversible charge–discharge cycle. In other words, the charge and discharge processes correspond to currents (ionic flows) with distinctly opposite directions. Nevertheless, this common sense will be strongly challenged in the case of deintercalation of BF4– anion from graphite electrode upon EC solvation.
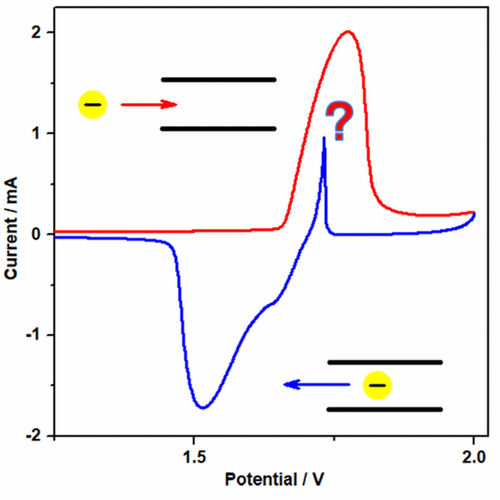
A typical cyclic voltammogram of natural graphite flakes in the BF4––EC solution is depicted in Figure 1. At first, with the rise in potential, an anodic current peak springs up in the potential range of 1.65–1.85 V, standing for the anion intercalation from the solution into the graphite electrode. When the potential scan turns backward, an inverse (cathodic) current peak (1.78–1.5 V) generally emerges due to the anion deintercalation from graphite electrode to the solution. To our surprise, a remarkable, and highly stable, countercurrent (anodic) spike sticks out at about 1.7 V during the cathodic sweep. It is of interest to investigate the origin of this unprecedented result.

Results and Discussion
The temperature dependence of this abnormal behavior is first investigated. As shown in Figure 2a, as the ambient temperature rises, the countercurrent shifts to a higher potential and the intensity is weakened. But when cooled down to 16 °C, it shifts back and recovers its intensity. Also, the scan rates differing from 0.05 mV s–1 to 8 mV s–1 were investigated at 16 °C, and the results are shown in Figure 2b. Compared to the CV curve of 1 mV s–1, when the scan rate is higher, the intercalation and deintercalation peaks become more obtuse along with the decrease of the intensity of the countercurrent. However, as the scan rate slows down, along with the sharper intercalation/deintercalation peaks, the countercurrent is also enhanced. But when the scan rate gets low enough (lower than 0.1 mV s–1), a new anodic current peak arises in the positive scan and, at the same time, the countercurrent disappears. It seems that the abnormal countercurrent corresponds to a temperature dependent anodic process that may be too sluggish to happen when charged quickly under 16 °C that somehow appears just ahead of the deintercalation.

Furthermore, we altered the cutoff potential of graphite electrode in CV measurements. In Figure 3a, when the cutoff potential is lower than 1.95 V, there is no countercurrent in the discharge part of the curves although the intercalation process has completed. But when the cutoff potential is set over 2.2 V, a new anodic current peak arises at high potential along with the reduction of the countercurrent (which even does not exist when the cutoff potential is 2.3 V). Moreover, three typical cutoff potentials (1.8, 2.0, and 2.2 V) were chosen for further investigation. The sweep-step technique was employed in the CV measurement to hold the electrode at the high cutoff potential for a period of time (for 0, 10, and 30 min, successively) before the back scan. As exhibited in Figure 3b, when the holding time is 10 min, the countercurrent in the curve of 2.2 V disappears while a countercurrent peak arises in the curve of 1.8 V, though the curve of 2.2 V shows no obvious change. So the abnormal anodic current relates to the polarization after the end of anion intercalation and can be pushed forward so long as the high potential lasts long enough. To sum up, the countercurrent comes from a sluggish and polarization-related anodic process that can be facilitated by heating and holding at high potential. As mentioned above, a conspicuous detachment of EC solvents from the intercalated BF4– inside graphite electrode can be witnessed. (38) So it is easy to imagine that the stripped EC molecule will obstruct the intercalation of BF4– and vice versa. Then a part of EC is blocked inside graphite electrode while a part of BF4– is blocked outside. On the other hand, because of the solvation state difference between the intercalated anions and those out of graphite electrode, there must be a resolvation course of the intercalated anions in their deintercalation process, either inside or out of graphite electrode. On the basis of the above considerations, we expected that if the resolvation takes place inside the graphite electrode, the BF4– anions that are blocked outside are likely to be involved in the flood of EC molecules before the mainstream of the anion deintercalation initiates, which may exhibit an anodic current peak in the cathodic scan section. This hypothesis of the anion backflow can temporarily explain the above results.

In situ electrochemical measurements are performed to obtain direct evidence. However, since the backflow is a transient process, most of the traditional in situ electrochemical measurements such as in situ X-ray diffraction (XRD) and in situ Raman spectroscopy are inappropriate for this task. Here, cyclic voltammetry–quartz crystal microbalance (CV–QCM) and in situ electrochemical dilatometric (ECD) measurements were combined for this task. As shown in Figure 4a, the mass of graphite electrode climbs up and then declines as BF4– intercalates into graphite electrode. This characteristic mass fluctuation proves the desolvation of the intercalated BF4– anions. And in the discharge part, the mass curve of graphite electrode remains steady until two elevations appear, corresponding to the countercurrent and deintercalation cathodic peaks in the CV curve, respectively. The mass variation at the countercurrent could be proof of the backflow of BF4– anions. As for the later mass elevation along with the significant deintercalation current, the movement of EC molecules from electrolyte solution into graphite electrode and the resolvation process inside graphite electrode can be confirmed. For easier recognition, the results of ECD and the corresponding individual potential profiles (IPP) of graphite electrode during galvanostatic charge–discharge measurement are plotted together in Figure 4b. As the ECD response strongly depends on the binder type of the working electrode, (14) in general, when the voltage goes up, the graphite electrode expands gradually as the anions intercalate in and then retracts as the anions deintercalate from the electrode. It is observable that a remarkable expansion can be seen in the ECD curve at about 2.9 V in the discharge process. In the corresponding IPP of graphite electrode, the abnormal expansion of graphite electrode in the discharge section locates at about 1.7 V where we can see a distinct bulge. It is worth mentioning that 1.7 V is also the start potential of the countercurrent of the CV curve. So the abnormal expansion of the graphite electrode in response to the countercurrent can be a powerful corroborative evidence of our conjecture.

From another viewpoint, the composition of the electrolyte solution can influence the performance of graphite electrode profoundly. On one hand, the effect of electrolyte concentration was studied. The CV curves of graphite electrode using the solutions with different SBPBF4 concentrations are shown in Supporting Figure 1. When its concentration changes from 0.5 to 3 M, the countercurrent peak locates at the same potential but becomes sharper. This trend can be correlated with the rising intensity of the anion intercalation peak along with the increase in SBPBF4 concentration. On the other hand, the cation plays an indispensable role as well. For instance, when LiBF4 replaced SBPBF4 as the electrolyte salt in the solution, the upper cutoff potential of the CV measurement had to be extended to 5.4 V (vs Li/Li+) so that the inverse current might be observed, as shown in Supporting Figure 2. This is caused by the strong ion-pair interaction between Li+ and BF4– that severely prevents the anion intercalation. In the solutions dissolving both LiBF4 and SBPBF4 (say, 1/1 by molar ratio), the upper cutoff potential that the inverse current could be detected was lowered to 5.2 V. This is in accordance to the result of our previous findings. (41)
Though supported by the above proof, there is still no visible method with which we can observe this abnormal process directly. On this occasion, finding out a counterexample will be a good way to step forward. It is well-known that the intercalation behavior of the same kind of anion is strongly dependent on the graphite type. Here we picked up different graphite samples to verify this phenomenon. CV curves of several typical graphite samples (KS6, SFG-15, LB-300H, MAGD-20, MCF, and MCMB) are shown in Figure 5a. In spite of the differences in peak shape, the countercurrent peak appears at about 1.7 V in the CV curves of almost all these graphite samples but MCMB. The graphitization degree numbers are labeled in parentheses. To our surprise, there seems to be no direct connection between the countercurrent occurrence and graphitization degree for these graphite samples, which was taken for granted as a most relevant factor. Figure 5b exhibits the ex situ XRD patterns of these graphite electrodes fully intercalated by BF4– anions and the corresponding intercalated gallery height (d) values (calculated according to the work of Schmuelling (24)). Since these samples differ in many respects, such as graphitization degree and morphology, etc., their XRD patterns after the anion intercalation have some minor distinctions. But all of them exhibit new diffraction peaks due to anion intercalation. The peak at about 18° comes from the binder of electrode. It is noteworthy that the d value of anion intercalated MCMB electrode is only 8.09 Å while the rest of the graphite samples have apparently larger values.

According to the results of CV–QCM (Figure 6a), the mass of MCMB electrode increases and then decreases as the anion goes in and out of it, and no characteristic mass decrease of the desolvation of the intercalated BF4– anions can be observed here. We cannot see any abnormal volume expansion or potential wave in the ECD-IPP curves (Figure 6b) of MCMB electrode during the deintercalation of the anions, and the potential platforms are not as flat as they are in the potential curve of NCC. So, on the basis of the above results, the direct contact between the countercurrent and the desolvation process of the intercalated anions is clear. As we know, the co-intercalation of solvent molecules with the anions into graphite electrode is the main cause of the overexpansion of graphite layer and leads to the structure destruction. We are inspired by the apparently smaller d value that the intercalated anions in MCMB may be desolvated to a big extent because MCMB is a kind of spherical graphite covered by a selective carbon layer. Then some EC molecules binding with the anion can be stripped off when they pass through the carbon layer. Without the interference of some EC solvents inside the graphite electrode, the origin of backflow is smeared.

Therefore, we attempted to awake the countercurrent in MCMB through the heat treatment as proposed by Hara (42) to break the carbon coating. Both CV and ex situ XRD measurements were executed on the heat-treated MCMB (HT-MCMB), and the results are exhibited in Figure 7a and Figure 7b, respectively. As we can see in Figure 7a, a countercurrent peak rises in the cathodic scan of HT-MCMB at about 1.7 V (which is similar to those of other graphite samples). Accordingly, the d value calculated from the ex situ XRD pattern increases from 8.09 Å (untreated MCMB) to 8.17 Å (HT-MCMB).

In CV–QCM (Figure 8a), obvious mass decrease can be seen in the anion intercalation process of HT-MCMB electrode, and the mass of HT-MCMB electrode grows when the anion deintercalation takes place. Furthermore, as shown in ECD-IPP plots (Figure 8b), the potential profile and ECD curve of HT-MCMB electrode turn out to be more angular compared to that of untreated MCMB, and a tiny protuberance emerges in its potential profile at 1.7 V corresponding to the countercurrent in the cathodic scan of the CV curve. Unfortunately, we could not get distinct QCM or ECD responses at this potential, which may be due to its spherical morphology. Although the characteristic mass change happening in HT-MCMB is not as drastic as in NCC and no evident volume expansion can be detected at 1.7 V in the discharge section, the desolvation effect of the surface layer of MCMB can be determined. The speculation on the cause of the countercurrent is supported once more.

Conclusion
In summary, the abnormal inverse current during anion deintercalation from graphite electrode is found. By analysis, we attribute the countercurrent to the backflow of the anions blocked at the margin of graphite layers by the EC solvent molecules stripped from the intercalated anions. In correspondence with the desolvation of the intercalated anions inside graphite electrode, according to the conspicuous mass growth of the graphite electrode when the deintercalation takes place, the resolvation of the anions during the deintercalation happens inside graphite as well. Therefore, the blocked anions could be carried by the in-rushing EC solvent molecules into graphite electrode when the resolvation happens. Once MCMB is employed, the direct relation of the desolvation and the countercurrent can be proved. Further, when the carbon layer at MCMB surface is burned, the countercurrent is observed again. Therefore, a brand new anion storage behavior is recognized, which is far beyond our common sense.
【Article link】
https://doi.org/10.1021/acsaem.9b00792